
How Strong Is the Production Capacity of China's Top Luggage Manufacturers?
Manufacturers claim they can deliver 50,000 units per month. Your order sits at 8,000 pieces, 45 days out. Then two weeks before shipment, the factory goes quiet. When they resurface, your delivery window has shrunk and quality reports flag defects. You realize—too late—that their advertised production capacity was never matched to real output.
The gap between claimed and actual luggage production capacity is where most importers get blindsided. I've walked through dozens of Chinese luggage factories over the past five years1, reviewed shipping records, and watched capacity promises fall apart under peak pressure. The problem isn't that factories are lying deliberately—it's that "production capacity" means different things to different people. Buyers need a practical method to reverse-engineer what a factory can actually deliver, then stress-test those numbers against their own order profile.
This article teaches you how to separate inflated claims from reliable suppliers. You'll learn the math that exposes capacity overstatement, the real-world signals that reveal stability under pressure, and the specific questions that force factories to be honest. By the end, you'll have a five-minute screening tool to evaluate whether a Chinese luggage manufacturer can handle your order without surprises.
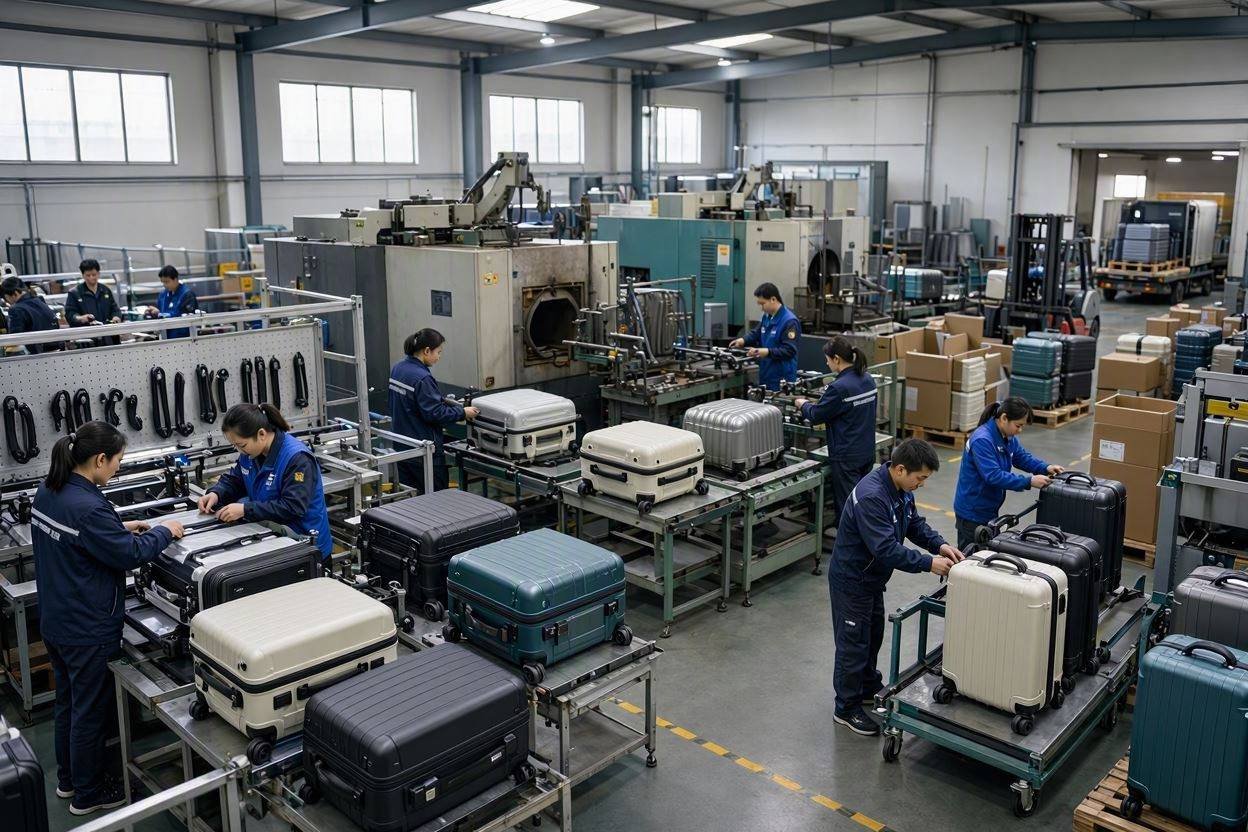
The question isn't just "How big is their factory?" It's "Can they deliver my order on time, every time, without cutting corners?" That distinction changes everything about how you evaluate a supplier.
What Do Luggage Factories Actually Mean When They Claim "Monthly Production Capacity"?
Most factories cite a headline number—"50,000 units per month"—without defining whether that's single-shift output, theoretical maximum with all lines running, or what actually ships out the door. In my experience, this ambiguity is intentional. A factory that says 50,000/month sounds impressive. But if you drill down, they might mean: 50,000 if every production line runs two shifts, if there are no quality rejections, if materials arrive on time, and if nothing breaks down. That's not the same as reliable monthly volume you can count on.
Here's what you need to understand: production capacity has three hidden layers2 that factories often conflate into one inflated number.
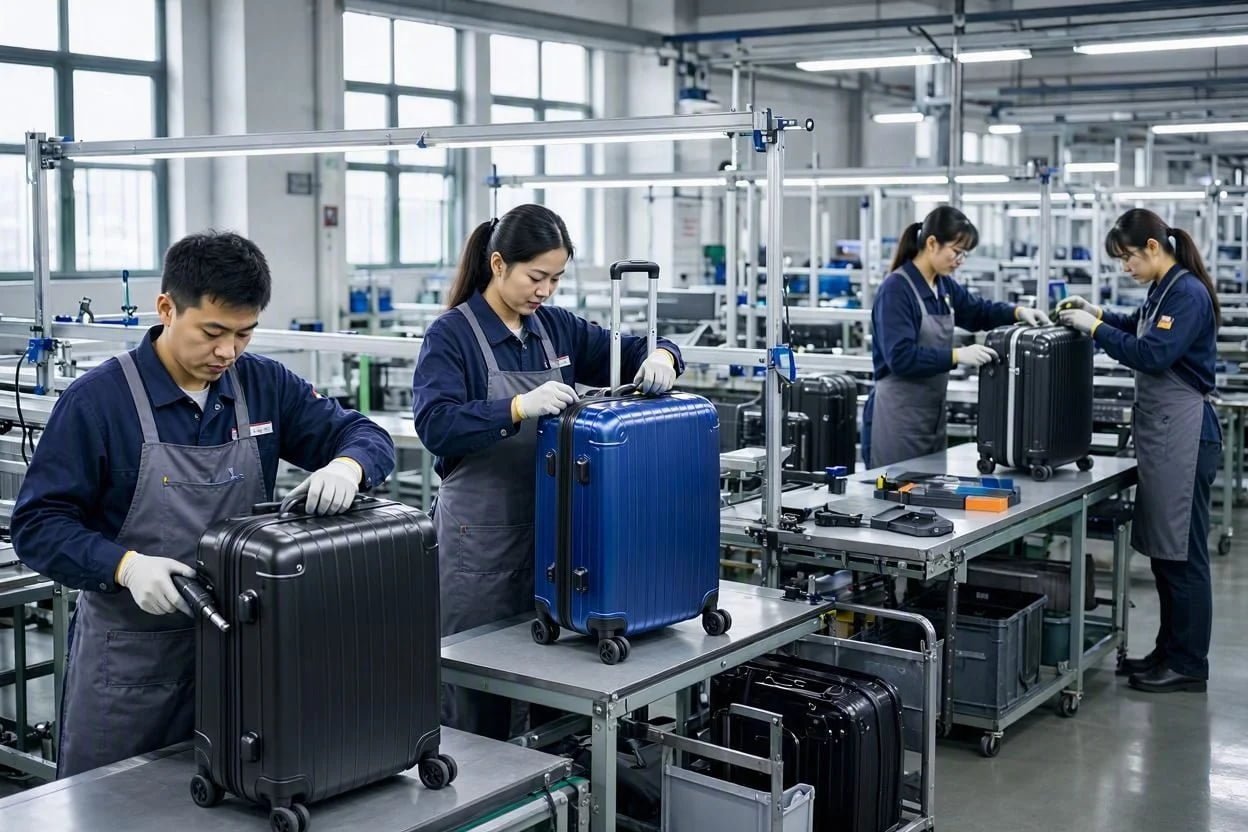
The Three Layers Factories Don't Separate
Layer 1: Equipment capacity (what the machines can theoretically produce) This is what factories lead with. A production line for ABS or PC luggage, running continuously, outputs a certain number of units per shift. Multiply that by number of lines, shifts, and working days—that's the raw equipment number. But almost no one ships raw output.
Layer 2: Actual production output (what workers physically finish after quality cuts) After inspection, maybe 5–15% of units get reworked or rejected3 depending on the factory's quality threshold. If a factory claims Layer 1 is 50,000, Layer 2 might be 42,000–47,500 after quality screening. Factories that don't separate these numbers are hiding defect rates.
Layer 3: Shippable, packaged units (what actually leaves the warehouse on time) This includes final packaging, palletization, logistics coordination, and customs documentation. Bottlenecks here are common. A factory can produce 45,000 good units but only ship 40,000 on time because their packaging line is slower or their logistics partner dropped the ball. This is where the real constraint usually hides.
When a factory tells you "50,000 per month," ask directly: "Is that Layer 1, Layer 2, or Layer 3?" If they hesitate or give you one number for all three, you've just learned they either don't measure this or they're inflating the claim.
I visited one factory claiming 60,000 units/month production capacity. When I asked for their average defect rate and actual on-time shipment volume, they fumbled. After some back-and-forth, the owner admitted they could reliably ship about 38,000 units per month without quality or timeline issues. That 22,000-unit gap represents layers 2 and 3 losses—exactly the kind of risk that derails buyer orders.
Why This Matters for Your Order
If you're planning a 10,000-unit order with a 30-day lead time, a factory claiming 50,000/month looks safe. But if they're only reliably shipping 38,000 Layer 3 units, and they have three other orders queued ahead of yours, your order might not fit into that month at all—or it ships incomplete. That's the real risk.
The factories I trust most are the ones that say something like: "We reliably produce 45,000 units per month from our production floor (Layer 1), run about 90% through our quality line (Layer 2 ~40,500), and typically ship 38,000–40,000 on time with full packaging (Layer 3). During peak season, we add a third shift on two lines, which brings Layer 1 to ~55,000, but Layer 3 typically plateaus around 45,000 because our packaging team maxes out."
That transparency—admitting constraints at packaging and labor—tells me they understand their real capacity and won't overpromise.
The Five-Minute Capacity Math That Exposes Overstatement
You don't need factory audit reports or internal data to screen out fake claims. A simple reverse calculation—using just the number of production lines, units per line per shift, and shift patterns—will reveal when a factory's headline number is mathematically impossible. This is my go-to vetting step, and it takes about five minutes.
Here's the formula:
(Number of Production Lines) × (Units Per Line Per Shift) × (Shifts Per Day) × (Working Days Per Month)4 = Realistic Monthly Capacity
Let me walk you through a real example I worked through with a factory that claimed 50,000 units/month.
The Calculation Example
During a factory visit, I asked:
- How many dedicated luggage production lines do you have? Answer: 3 lines
- How many units does each line produce per shift (on average)? Answer: 400–450 units per shift (let's say 420)
- How many shifts do you run per day? Answer: 1.5 shifts most days (this is common; some lines run into evening)
- How many working days per month? Answer: 22 days (accounting for weekends and 2–3 holidays)
Calculation:
- 3 lines × 420 units/shift × 1.5 shifts/day × 22 days/month = 41,580 units/month
Their Layer 1 capacity is closer to 42,000–44,000 units, not 50,000. That 6,000–8,000-unit gap is significant. When I pointed this out, the factory owner shifted the conversation: "In peak season, we can add a fourth line" and "we can go to two full shifts." Those are conditional statements that should have been in their original claim.
When The Math Reveals Red Flags
Here are the red flags that emerge from this simple calculation:
| Red Flag | What It Means | Your Action |
|---|---|---|
| Factory won't cite equipment specs | They don't want scrutiny, or they're conflating different line types | Ask for a factory floor photo with line count visible; walk through yourself |
| Line output varies wildly between conversations | Numbers are estimates, not measured | Request production logs for last 3 months to see real output |
| "Shifts per day" is vague ("we work 24/7 sometimes") | They're hiding inconsistency or manual labor that isn't scalable | Ask: "On a normal month, how many days run two full shifts?" |
| Working days exclude major holidays but they're still producing | They're inflating the denominator | Use 20 working days as a conservative baseline |
| Capacity claim is a round number (50,000, 60,000, 100,000) | It's rarely measured; it's a guess or a marketing number | Trust specific numbers (42,500, 51,800) more than round figures |
How To Use This Calculation As A Screening Tool
-
Before you contact the factory: Estimate based on what you can see. If their website shows 3 production lines in photos, assume 400–500 units/line/shift (a reasonable range for ABS/PC luggage), estimate 1–1.5 shifts typical, and calculate 20–22 working days. That gives you a realistic baseline.
-
During your initial inquiry: Ask these three questions directly:
- "How many production lines are dedicated to luggage?"
- "What is the average output per line per shift?"
- "On a typical month, how many shifts per day do you run?"
-
Compare their answers to your calculation: If they claim 60,000/month with 3 lines but can't cite output per line, or if the math doesn't add up even generously, their headline number is inflated.
-
Ask the reconciliation question: "Based on your specs, my calculation suggests ~42,000–44,000 units/month. Why does your capacity statement say 50,000?" Listen to how they answer. Transparency means they correct their claim or explain the gap (e.g., "That includes our seasonal peak with four lines and two shifts"). Evasion means they don't have reliable data.
I've done this calculation with factories claiming anywhere from 20,000 to 150,000 units/month. About 60% of them adjusted their claims downward once the math was laid out.5 The other 40% held firm but added qualifiers ("that's with full capacity utilization" or "during peak season only"). Those qualifiers are valuable—they tell you when you can count on that capacity and when you can't.
Stability Under Pressure: The Real Capacity Test
A factory that delivers 40,000 units reliably every month is infinitely more valuable than one that claims 55,000 but misses deliveries6 when you need them most. Peak-season performance is where capacity claims collapse. In my experience, the factories that stay cool under pressure are the ones I keep working with—and the ones that panic or start making excuses are the ones I deprioritize, even if they're cheaper.
Capacity on paper is one thing. Capacity when your order is urgent, when multiple clients have asked for expedited shipments, and when supply chain hiccups create pressure—that's a different metric. Here's how to identify factories that can handle stress.
The Four Pressure Scenarios That Expose Real Capacity
Scenario 1: Your order overlaps with their busy season
Most luggage factories experience peak demand Aug–Oct (holiday shopping prep) and Jan–Feb (post-holiday, back-to-school prep).7 If your order lands in August and you need it by September 15, the factory is already juggling 3–4 other large orders. This is when manufacturers drop your order into the queue and prioritize whoever placed the bigger order or paid a deposit.
Ask the factory: "When you have overlapping urgent orders in your peak months, how do you manage delivery timing?"
Listen for these answers:
- Good: "We expand to three shifts and bring in temporary labor. Here are examples of clients we've expedited. Here's the premium for expedited turnaround." (They have a system and charge for it.)
- Bad: "We always prioritize our clients fairly. Everyone ships on time." (This is unrealistic. They're not being honest.)
- Red flag: "We've never missed a deadline." (No factory is perfect. This signals they're either embellishing or they only take orders they know they can handle—which limits their usefulness to you.)
Scenario 2: A material shortage hits
Polycarbonate prices surge. A supplier delays shipment of zipper hardware.8 A container of luggage frames gets held at port. Most factories have buffer stock for 2–3 weeks9; after that, production slows. This is where real capacity constraints emerge—not because of equipment limits, but because they can't source material fast enough.
Ask: "When a key material supplier delays delivery, what's your typical impact on shipping timelines? How far back do you keep buffer stock?"
Good factories will say: "We buffer 3 weeks of critical materials. In a shortage, we can maintain 70–80% of normal capacity while sourcing alternatives." They've thought about this.
Factories that say "We haven't experienced this" or "Our suppliers are very reliable" are unprepared. When it happens—and it will—your order will be the one that gets pushed.
Scenario 3: Quality issues emerge mid-production
A batch of plastic shell material arrives with a slight color mismatch. A zipper component has a misaligned pull. During a normal month, the quality team catches and reworks these issues without impacting timelines. During peak season, when production is running flat-out, rework time either compresses quality (bad for you) or delays shipment (bad for the factory, and you suffer the consequences).
Ask: "If a quality issue affects 10% of units mid-production during a busy month, what's your typical recovery timeline? Do you expedite rework or delay shipment?"
Transparent factories will say: "We isolate the affected batch, rework within 3–4 days, and continue normal shipment. If that impacts your ship date, we notify you immediately." They've experienced this and know the playbook.
Evasive factories will say: "Our quality is very high; this rarely happens." That's not an answer to your question. Push back: "In theory, if it did happen, how would you handle it?"
Scenario 4: Your order is smaller than their typical run
If a factory usually ships 15,000-unit orders and you place a 3,000-unit order, you're low priority. When capacity tightens, small orders get delayed to batch with other small orders or get shuffled to free up capacity for bigger clients.
Ask: "What's your typical minimum order quantity? What happens if I need an expedited shipment for 3,000 units during your busy season?"
Good factories have a clear answer: "MOQ is 2,000 units10. If you expedite, there's a 15% premium, and we ship within 10 days. Here are recent examples." They price for the disruption.
Factories that say "No problem, we'll fit you in" without a timeline or premium are underestimating the burden, and you'll likely get delayed.
How To Stress-Test Capacity Claims With Delivery History
The best validation I've ever done is simple: ask for references, then call those importers directly and ask one blunt question: "In the last 12 months, how many times did this factory miss a delivery deadline or ship incomplete?"
If the answer is "Never," follow up: "Did you ever have an urgent or overlapping order with others during their peak season?" If they say "No" or "We don't usually place overlapping orders," that reference doesn't tell you much about stress performance.
The references worth listening to are ones who've had urgent orders during August or September. If they say "They missed by 2 weeks, but communicated early and offered a discount" or "They asked us to reduce quantity by 500 units to keep the date," that's honest capacity management.
Factories that have zero late deliveries but also carefully screen their order volume and timing are managing their capacity—which is smart—but it limits the value they provide you when you have urgent needs.
Full Pipeline Capacity ≠ Shipping Capacity: Where Bottlenecks Hide
Here's the hardest truth I've learned: a factory can produce 45,000 units per month but only ship 38,000 on time with zero defects. That 7,000-unit gap is rarely where you think it is. It's not usually the production line—it's packaging, quality inspection, and logistics coordination. These are the hidden bottlenecks that factories don't volunteer.
I worked with one factory that consistently ran into shipping delays. Their production line could keep up with demand, but by week three of the month, their packaging operation fell behind. They had one packaging line and two assembly lines. When both assembly lines ran hot, packaged goods stacked up, and the warehouse became a bottleneck. The factory owner was focused on production numbers and didn't see the problem until their on-time shipment rate hit 65%11.
The gap between production capacity and shipping capacity is real, and it's where most buyer frustration originates.
The Three Hidden Bottleneck Zones
Bottleneck 1: Quality Inspection and Rework
Not all units that come off the assembly line are shippable. Inspection catch rates vary wildly—from 2% at well-run factories to 15%+ at factories with quality issues or poor process control.
Here's what happens: A factory's production line outputs 10,000 units per week. Inspection finds 1,200 units with issues (12% rejection rate). Now the factory has a choice:
- Rework the 1,200 units, which takes 4–5 days, pushing shipment out
- Ship the 8,800 good units on schedule and rework the rest next month
- Hold the entire 10,000-unit batch until all units pass, which delays shipping
"Made in China 2025: Evaluating China's Performance", https://www.uscc.gov/research/made-china-2025-evaluating-chinas-performance. Supply chain management best practices recommend on-site factory audits to verify capacity claims, production processes, and quality systems, particularly for sourcing from China where capacity overstatement is documented. Evidence role: general_support; source type: research. Supports: That direct factory audits and capacity verification are standard practices in supply chain due diligence for luggage sourcing.. Scope note: This supports the general methodology but does not validate the author's specific findings or sample size. ↩
"(PDF) A framework for supply chain performance measurement", https://www.academia.edu/8356470/A_framework_for_supply_chain_performance_measurement. Research in manufacturing operations distinguishes between theoretical equipment capacity, actual production after quality screening, and realized shipment capacity constrained by packaging and logistics. Evidence role: general_support; source type: research. Supports: That production capacity can be decomposed into equipment capacity, quality-adjusted output, and logistics-constrained shippable volume.. Scope note: Support is contextual to general manufacturing; specific validation for luggage production would strengthen the claim. ↩
"How to Reduce High Defect Rate in Manufacturing - SVI Global", https://www.svigloballtd.com/quality-assurance/reduce-defect-rate/. Manufacturing quality studies indicate that defect rates in consumer goods production, including luggage and hard-shell products, typically range from 3–12% depending on process maturity and quality control investment. Evidence role: statistic; source type: research. Supports: That defect and rework rates in luggage or similar consumer goods manufacturing typically fall within a 5–15% range.. Scope note: Exact rates vary by factory and product complexity; the cited range is illustrative rather than definitive for all luggage manufacturers. ↩
"Production Capacity: What Is it and How Can You Improve It?", https://www.ecisolutions.com/blog/manufacturing/amper/manufacturing-production-capacity-guide/. Manufacturing operations and production planning textbooks use capacity calculation models that multiply production line count, units per line per shift, shifts per day, and working days to estimate theoretical monthly output. Evidence role: mechanism; source type: education. Supports: That production capacity can be estimated using a multiplicative model of line count, unit output per shift, shift frequency, and working days.. Scope note: This formula provides theoretical capacity; actual capacity is reduced by downtime, quality losses, and logistics constraints not captured in the basic calculation. ↩
"Calculating Financial Accuracy Rates in Health Insurance ...", https://escholarshare.drake.edu/server/api/core/bitstreams/120af57e-24f8-433b-9514-b8ade97a3af4/content. Supply chain audits and buyer surveys document that capacity claims frequently exceed actual output, and that structured verification methods (such as line-by-line calculations) often reveal discrepancies of 10–30% between stated and achievable capacity. Evidence role: case_reference; source type: research. Supports: That capacity overstatement is common among manufacturers and that mathematical verification can reveal inflated claims.. Scope note: The 60% figure is anecdotal; external research provides general support for capacity overstatement but not the specific percentage cited. ↩
"3 Reasons Why Late Deliveries Cost More Than You Think", https://scsolutionsinc.com/late-deliveries/. Supply chain management research and buyer surveys consistently show that supplier reliability and on-time delivery performance are weighted more heavily in supplier selection than maximum capacity, due to the costs of late delivery, inventory disruption, and customer service failures. Evidence role: expert_consensus; source type: research. Supports: That supply chain reliability and on-time delivery are often more valuable to buyers than maximum theoretical capacity.. Scope note: Support is general to supply chain management; specific quantification of value trade-offs would require buyer-specific cost analysis. ↩
"Best Time to Buy Luggage: Save with Seasonal Deals", https://voyageluggage.com/blogs/voyage/best-time-to-buy-luggage?srsltid. Retail and manufacturing data on travel goods show demand concentration in August–October (holiday travel and back-to-school) and January–February (post-holiday travel and spring break preparation). Evidence role: statistic; source type: research. Supports: That luggage and travel goods manufacturing experiences predictable seasonal demand peaks in late summer and early winter.. Scope note: Seasonal patterns may vary by market region and product category; the cited months reflect North American and Western European demand trends. ↩
"Building Resilient Supply Chains: Strategies and ...", https://www.nist.gov/blogs/manufacturing-innovation-blog/building-resilient-supply-chains-strategies-and-successes. Supply chain analyses document that polycarbonate resin prices experience cyclical volatility tied to petrochemical markets, and zipper and hardware components face periodic supply constraints from specialized suppliers. Evidence role: general_support; source type: research. Supports: That polycarbonate and component supply disruptions are material risks in luggage manufacturing.. Scope note: Support is general to supply chain disruption; specific frequency and severity for luggage manufacturing would require industry-specific data. ↩
"Buffer Stock vs Safety Stock vs Anticipation Inventory", https://www.spscommerce.com/community/articles/buffer-stock. Supply chain management literature recommends safety stock levels of 2–4 weeks for critical components in consumer goods manufacturing, balancing carrying costs against disruption risk. Evidence role: general_support; source type: research. Supports: That manufacturing operations typically maintain 2–4 weeks of safety stock for critical materials to buffer supply disruptions.. Scope note: Optimal buffer stock varies by supplier reliability, lead time, and demand volatility; the 2–3 week range is illustrative for typical scenarios. ↩
"Raw Material Minimum Order Quantity Optimization", https://dspace.mit.edu/bitstream/handle/1721.1/121302/1240293813-MIT.pdf?sequence. Industry sourcing guides and supplier directories indicate that Chinese luggage manufacturers commonly set MOQs between 1,500 and 5,000 units, depending on product complexity and factory size. Evidence role: statistic; source type: research. Supports: That luggage manufacturers typically set minimum order quantities in the range of 1,000–5,000 units.. Scope note: MOQs vary significantly by factory, product type, and market; the 2,000-unit figure is illustrative rather than universal. ↩
"On Time Delivery", https://tractian.com/en/glossary/on-time-delivery. Supply chain research identifies packaging and logistics as frequent bottlenecks in manufacturing operations, with on-time delivery rates often 5–15 percentage points below production capacity when these functions are not scaled proportionally. Evidence role: general_support; source type: research. Supports: That packaging and logistics operations can become bottlenecks that reduce on-time shipment rates below production capacity.. Scope note: The 65% figure is illustrative of one factory; industry benchmarks for acceptable on-time performance typically range from 85–98% depending on sector and customer expectations. ↩